

Virtual Collecting:
The Virtues of Electronic Cartography
John Woram
Not strictly about Galápagos cartography, but presented here anyway for general interest, and derived from a print version in Mercator's World, January/February 2002, Volume 7 Number 1. The document presented here adds a few details based on additional research since then.—JW.
As one's map collection grows it's important to set up a budget for certain necessary peripheral accessories, such as a larger house (read, more wall space), and/or flat-file cabinets with lots of extra drawers, which will magically fill themselves in very little time—or in less time than that if the larger house doesn't fit into the budget. But even if you can manage both the house and the file cabinets, the problem of keeping track of everything remains, and if you're so-inclined, of accommodating people who'd like to see your collection.
Here's where the personal computer and a modern web browser can be put to good use. If you can scan your map collection and handle a bit of HTML coding work, you can create your own virtual map collection which can be shared with others, or reserved for your eyes alone. If you do want to make your collection available to the public, a website is a nice way to do it, but certainly not required if you'd rather not take on that task. Instead, you can simply store your collection on CD-ROM and distribute copies by whatever means you like. But not even that is necessary: your collection can reside on your own hard drive if there's no need to make it available elsewhere.
A web search quickly reveals that the electronic map collection is hardly a new idea, for there are already hundreds, perhaps thousands, of online resources out there. In fact, Tony Campbell, now retired from his post as Map Librarian at the British Library, maintains a comprehensive resource of links to such sites at his own Map History/History of Cartography site (http://www.maphistory.info/index.html). Many links lead to very important collections, and it may be intimidating to contemplate adding one more site to the list. Yet the private collector may be able to compete with the big institutions in areas where they have neither the time nor inclination to tread. As a public service many such organizations are scanning their collections to make them more accessible to the public, and to help preserve the originals from excessive handling. Their websites are virtual map museums; priceless resources if you can't get to the real sites in person, but not set up to offer anything more than a look at the maps you want to study, one at a time of course.
By contrast, the private collector may offer viewers a detailed look at perhaps a single aspect of maps and map collecting, customized with selected views, cross-links and references that would just not be possible on an institutional venue without a resident specialist in the area—to say nothing of a healthy budget too. Here are a few examples of techniques that have worked well on my own site, and with appropriate modifications might be found useful elsewhere.
The Hyper-Linked Bibliography
To begin at the end, consider that necessary academic addendum, the bibliography…or worse, the annotated bibliography. Here, the author dazzles the reader with the depth of his research, and with a bit of extra work produces an impenetrable forest of annotations that must be accepted pretty much on faith, or simply ignored by all but the most determined. Or at least that's the way it is on paper. But once we move into the world of the browser, the bibliography can play a leading role in the production. At its simplest level, it appears to be nothing more than what one sees on paper. But at one step beyond that, the name of each map can be a link that displays that map in the browser window. And, if a cartographer's map appears in someone else's atlas, the atlas name can be a link to the place in the bibliography where that work is cited. If it's appropriate to compare one map with another, additional links can offer that option to the viewer. In short, the electronic bibliography can become the tail that wags the virtual dog. Instead of simply informing the reader of where everything came from, it becomes the gateway to everything. Strictly speaking, that's what the conventional bibliography does at the end of the book, but now the same information becomes the electronic front matter.
| Bowen, Emanuel | |
|---|---|
| 1744 | The Gallapagos Islands Discovered and Described by Capt. Cowley in 1684. In John Harris' Navigantium atque Itinerantium Bibliotheca (Volume 1, p. 79, 2nd and 3rd editions). Bowen's map is based on a Herman Moll map in “Cowley's Voyage Round the Globe” but with Text Commentary about Captains Woodes Rogers and [Edward] Davis added at bottom. |
| Bowen, Emanuel | |
|---|---|
| 1744 | The Gallapagos Islands Discovered and Described by Capt. Cowley in 1684. In John Harris' Navigantium atque Itinerantium Bibliotheca (Volume 1, p. 79, 2nd and 3rd editions). Bowen's map is based on a Herman Moll map in “Cowley's Voyage Round the Globe” but with Text Commentary about Captains Woodes Rogers and [Edward] Davis added at bottom. Compare Bowen and Moll maps. Compare five versions of this map. |
The two bibliographic entries shown here represent the same information as it might appear on paper (above) and in an electronic version displayed in a browser window (below). In either medium, the viewer who seeks nothing more than a conventional citation has it here. But in the browser version, a single click on one of the underlined segments displays either the actual map cited in the entry, details about the work in which it appears, or supplementary details about related documents and maps. Thus, this simple entry offers the viewer convenient-and instant-access to the following information:
- Emanuel Bowen's map,
- John Harris's atlas in which the map appears,
- Herman Moll's earlier map,
- William Cowley's bibliographic citation,
- Text commentary at the bottom of Bowen's map,
- Woodes Rogers' bibliographic citation,
- A comparison of the Moll and Bowen maps,
- A comparison of five similar maps.
Of course all of the above resources are available on paper, but are presumably not within easy reach of every viewer. Or even if they were, it would be awkward at best to find the desired information within each document in a reasonable amount of time. But thanks to HTML and modern browser technology, the above resources can be made readily available to a much larger audience than would otherwise be possible.
Comparison of Ancient and Modern Charts
Perhaps the fine art of map comparison began shortly after the world's second map was created, and someone said “Yes it's all very nice, but how does it compare with that other one?” The two were placed side-by-side, comparisons were made, and we've been doing the same thing ever since because until recently there wasn't much else we could do. But now, it's reasonably easy to experiment with comparisons that would not have been possible without the assistance of a personal computer.
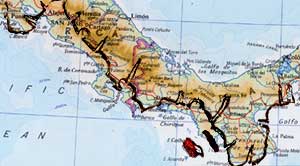
As one example of what can be done, I had another look at an early 16th-century vellum chart of the Pacific coast of Central and northern South America. The chart appeared in “The Year of the Tortoise” (Mercator's World, May/June 2000). At first glance, it appears more decorative than functional, with a coastline that would surely suffer in comparison with 21st-century reality. Or would it? There's only one way to find out, and it's not by putting it on the table next to a modern map. For one thing, the scales won't match, and there's simply too much extraneous detail that gets in the way. Given lots of time, a few measuring devices and a decent calculator, some conclusions might be drawn, but still the comparison leaves much to be desired.
Fortunately there's now an easier way, and one that offers a better view of the similarities and differences between the maps. To begin, both images must be scanned and imported into a computer graphics editing application such as Adobe Photoshop. Then, all that extraneous detail on the vellum chart image can be stripped away, leaving just the coastline on a transparent background. The next step is to find two prominent landmarks that can be identified on both maps. Unless you're very lucky, the distance and angle between them won't match at first, but it's no problem to make the necessary adjustments. For example, if the distance between points A and B is 500 pixels on one and 400 on the other, either can be re-sized to match the other. Or both can be re-sized to some convenient dimension. Next, rotate one of the images so that the angle between the points agrees with the other. The final step is to “drag” the vellum chart image onto the modern map image, then move it around until points A and B line up. They will do so of course, because you've already made the necessary adjustments. And now, everything else may or may not line up, depending on the accuracy of that old chart. As for the accuracy of the comparison itself, note that neither map has been distorted to force it into an agreement that doesn't really exist. Only the overall scale has been adjusted, while the original ratio of length to width has been preserved.
 |
To this amateur observer, the coast outline from that old vellum chart more than holds its own against its modern counterpart, and when I consider the 400+ years that separate them, I'm even more impressed with the skills of the unknown 16th century chartist. Additional views of both images.) |
|---|---|
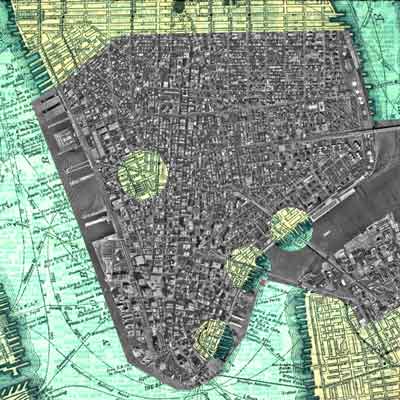 |
An 1895 map of lower Manhattan was pressed into service for a variation in the technique just described. It shows the Brooklyn Bridge which pre-dated it, but only dashed lines for the proposed “third East River Bridge” now known as the Manhattan Bridge. To put it to the test, a satellite image of the same area was placed on top of it-again after being scaled and rotated as needed. Then, parts of the satellite image were electronically “peeled away” to reveal the old map lying underneath. The bridges, real and proposed, line up quite well, as do most of the streets and the general contour. |
Of course these examples represent two best-case comparisons, and not every old map can be expected to do as well when compared with its modern counterpart. Nevertheless, such comparison techniques can be quite helpful in spotting those areas where the old and the new agree, and other areas where they don't.
Tracking the Voyage of the Beagle
Researchers have been reconstructing voyages for years, and did so quite nicely long before the age of personal computers. However, a certain amount of “cut-and-try” was necessary, along with a drafting table, a good eraser and lots of tracing paper. The task was not made easier if bearings in the ship's log referred to locations not found on a modern chart. As one such example, the log of H.M.S. Beagle reports three bearings taken at 8:00 am on 10th October, 1835 while the ship was at the Galápagos Islands. The log identifies the landfalls as “Rocky Islet, Peak on Breakfast Island,” and “West extreme of James Island.” Unfortunately, “Rocky Islet” is too ambiguous to be useful, and the name “Breakfast Island” is apparently an invention of someone on the ship to describe one of the dozen or so satellite islands surrounding James Island, but which island is anyone's guess. Fortunately, James Island is well known today, but even so its “West extreme” depends on where the Beagle was at the time the entry was made.
Adobe Photoshop's “layers” feature is handy for doing a bit of virtual drafting work with minimum trial-and-error required to determine the ship's position at eight o'clock on that October morning. First, a scan of the known island and its surrounding area is opened in Photoshop, and a new layer is added to the file. This layer is the electronic equivalent of a transparent sheet laid on top of a paper map. For the moment, there's nothing on it, but like the transparent sheet, the layer can be manipulated quite independently of the map itself. In fact, the map layer can be temporarily turned off so that it doesn't distract us. Now, just place a little dot on the transparent layer at any convenient location, to represent the good ship Beagle. Draw three lines from the dot to agree with the bearings reported in the log. We don't know where these lines should end, so just draw each one until it approaches the edge of the window. Now, save the file again and turn the map layer back on. With both layers visible, move the transparent layer around until the line representing the bearing to that “West extreme of James Island” touches the island at some point near its western end. This exercise suggests something that might otherwise escape notice: The entry is probably an error, because the “West extreme” would not be visible from the Beagle's approximate position at the time. Taking this into consideration, there appear to be three possible positions for the ship, based on how one interprets the entry:
- The entry should be written as the North extreme.
- It refers to the western-most point that was visible at the time.
- It should be written as the East extreme.
The third alternative seems the most likely and if it is used, the other two bearing lines neatly intersect two known islands. Thus we find that FitzRoy's “Breakfast Island” is the modern Isla Beagle, and the ambiguous “Rocky Islet” is Isla Eden.
All three possibilities can be sequentially displayed on a small map of the area, something that on paper would require either three examples, or one example with all three bearing sets on it.
As an added bonus (once ambiguities such as the above are resolved), we don't have to face the task of transferring bearing lines from a transparent sheet of plastic to a sheet of paper. Instead, we cut off the excess line lengths beyond the point where they touch the three landfalls, then “flatten” the image. This operation does the job for us: the transparent layer is removed, leaving the dot and the three lines on the map. Or if you like, the lines can be completely erased, with just the dot remaining to show the position of the ship. After repeating this procedure for every bearing in the log, all that remains is to “follow the dots” with a line that traces the ship's track through the area of interest.
To go one step further, we can write the date next to each dot so the viewer will know just when the bearing was taken. Of course we could do that on paper too, but now we can add a feature that has no counterpart in non-electronic media. Each such date can serve as a link to the ship's log: click on the number and the log for that entry appears in a separate window. Scroll through that window to view other entries, or close it to return to the map and move on to some other point.
Needless to say all of this requires a bit of work, but some of it is no more than would be required to do the same job on paper. The links into the ship's log are of course another matter, because someone must face the task of transcribing the log into HTML format. It's a tedious chore at best, but once done it makes the job of following a ship across a map, and reading the log as you go, a lot easier than it would be by traditional means.
This chart displays the track of H. M. S. Beagle during September and October 1835. Click any number (date) on the chart to display the ship's log for that set of bearings. Press any key first and Darwin's Diary for the same date is displayed.
The Virtue of Virtual Restoration
One advantage of presenting maps on a website—or on a CD-ROM—is that a certain amount of electronic “restoration” can produce a virtual image that is in better apparent condition than the real one. As one example, an old map that has separated into two or more segments over the years can be put back together again, something one might not dare do to the original. And, within reason, missing fragments can be reconstructed by cloning adjacent intact sections or by pasting a copy of a visually similar area over the missing portion. Finally, colors can be enhanced, stains removed and text sharpened. These and other techniques are possible with most modern image-editing applications and, if not overdone, can enhance the appearance of a time-battered map.
But do proceed with caution. Map researchers need to know what an old map really looks like today, and may or may not be interested in what it might have looked like when it was created. So if you show a restoration, show the original too. Some will be interested in one, some in the other, but all will want to know which is which. Make sure you tell them.
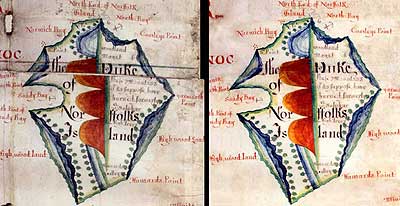
This before-and-after example shows a virtual repair made to an old chart. For the sake of “truth in reporting” it's important to inform the viewer that the edited image does not represent the original source, either by also showing the source, or by stating that fact in the accompanying text.
These examples describe only a few of the many HTML techniques that can be used to present one's map collection in a format that goes several steps beyond the limitations of the traditional print medium. The same techniques can be applied to a website, to a CD-ROM, to a collection of files on a hard drive, or to any combination of these ingredients.